
How I select Stock Setup ?
Swing Trading

Hello Friends ! Hope you all are doing well. In previous two posts I explained about metrics that you need to know in order to Know Your Trading & hence make necessary adjustments accordingly. Now today I’m going to discuss one of the most common question - Which stocks we should look for ? Are there any criteria’s ? Any checklist ? Can we trade any High momentum stock or is there any specific criteria of setup. All of these questions will be answered in depth & in simple manner so you can spot those stock setups on your own. We’ll discuss template/checklist below. Hope you all love it.
Objectives - Let’s clear the objectives first, as there are so many different types of traders/ Investors & each having their own objectives & hence different methods/process to arrive at particular stock. I’m Momentum Swing Trader ; Which basically means I trade Breakout/Pullback (Continuation Setups) in already established strong up trending momentum stock & enter in low risk High reward setup. So my objective here is to Trade High RS, High Momentum, Up trending stock. Let’s deep dive on how we can get them.
Basic Principle Of Momentum -
Stocks in unidirectional Momentum remains in momentum. (Not indefinitely). - This is very basic principle you have to hammer in your mind. It resembles with Newtons First law - Law of Inertia which say’s that “Object in a motion remains in that motion unless acted on by unbalance force.” Same applies to stocks as well.
Stock may set into motion due many reasons like Bull Market, valuation Gap, Fundamental Story, Strong demand etc. Reason might be anything but what matters to us is that stock which is set into up trend.
Vehicle (Stock) Selection Is Important - This concept is taught by my mentor Pradeep Bonde. If you chose a Bugatti Veyron as your vehicle as against say a Ford Mustang in a race, no matter how bad a driver you are, your probability of winning race is high. Isn’t it ? So selecting right stock consistently to grow your account rapidly is very very important and basic necessary step of trading process. It’s not that hard but we have to learn & train our mind. So, Find The Stock With High Probability Of going Up. Because you want follow through buying after you enter into the stock, that’s how swing traders make money. But how we are going to know that after entering stock will go up ? No one actually ! There is no 100% certainty that stock will go up after you buy & you should not try as well to predict such things, but yes you can evaluate odds of winning on bet by things that we will discuss further. Higher the conditions match with your trade higher will be odds of success. So, let’s discuss those criteria’s.
How Do I Find Fastest Stock With The Most Potential - Below I’ll discuss step by step guide of what I look for in stock to consider for trading. Our goal is to find that “Super Stocks” where big institutions are interested.
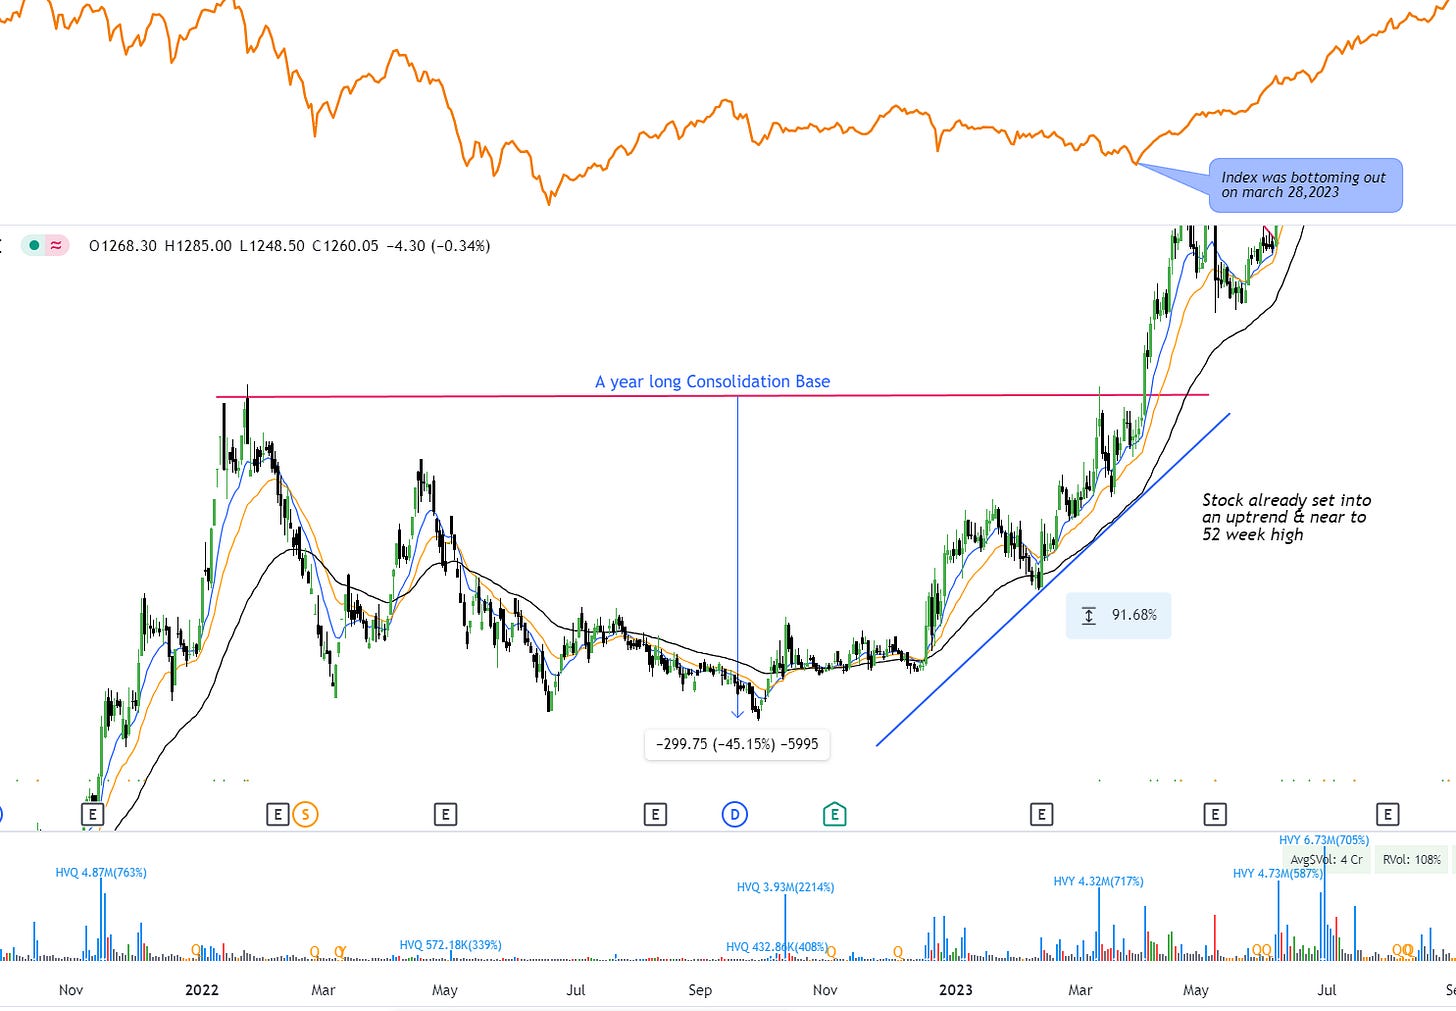
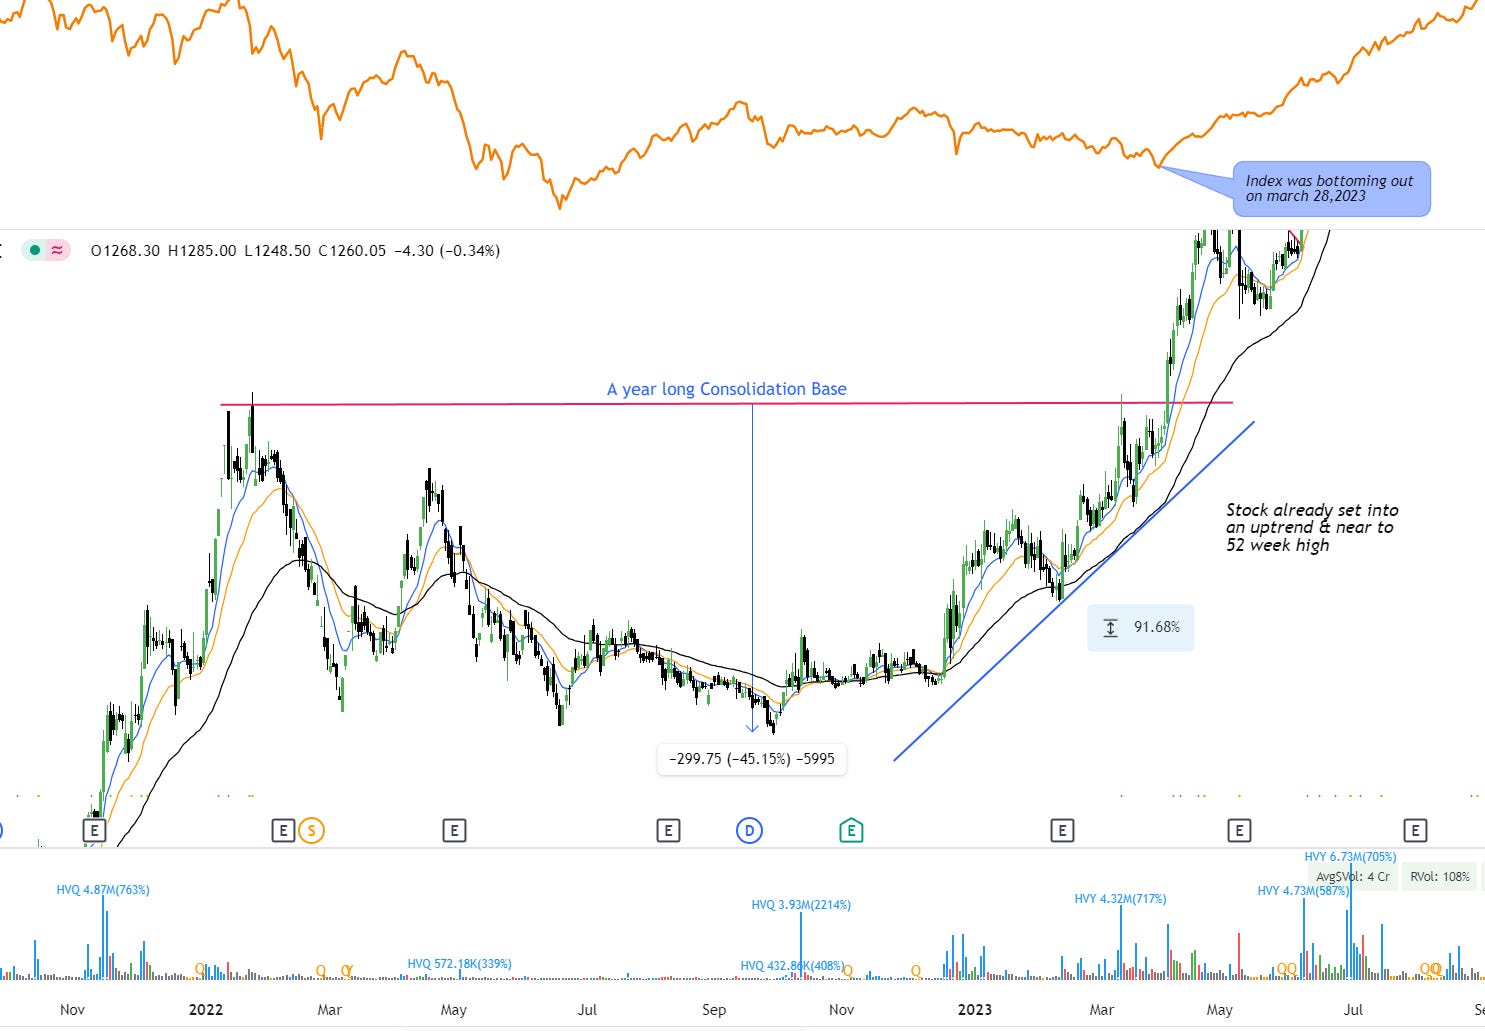
High Relative Strength - Stock must be in stage 2 (Advancing phase) ahead or in synch with indices - Either coming out of long base to new 52 week high / new all time high OR Strong up move followed by deep correction.(Note - I prefer stock trading at new 52WH/ATH, but that doesn’t mean I ignore other strong up moves in case of deeply beaten down stock.) Simple way to find High RS stocks is to compare stocks with index (CNX500, NIFTYSMLCAP 250 as we are working in Small & Mid cap stocks)
Ex of High RS Stock-
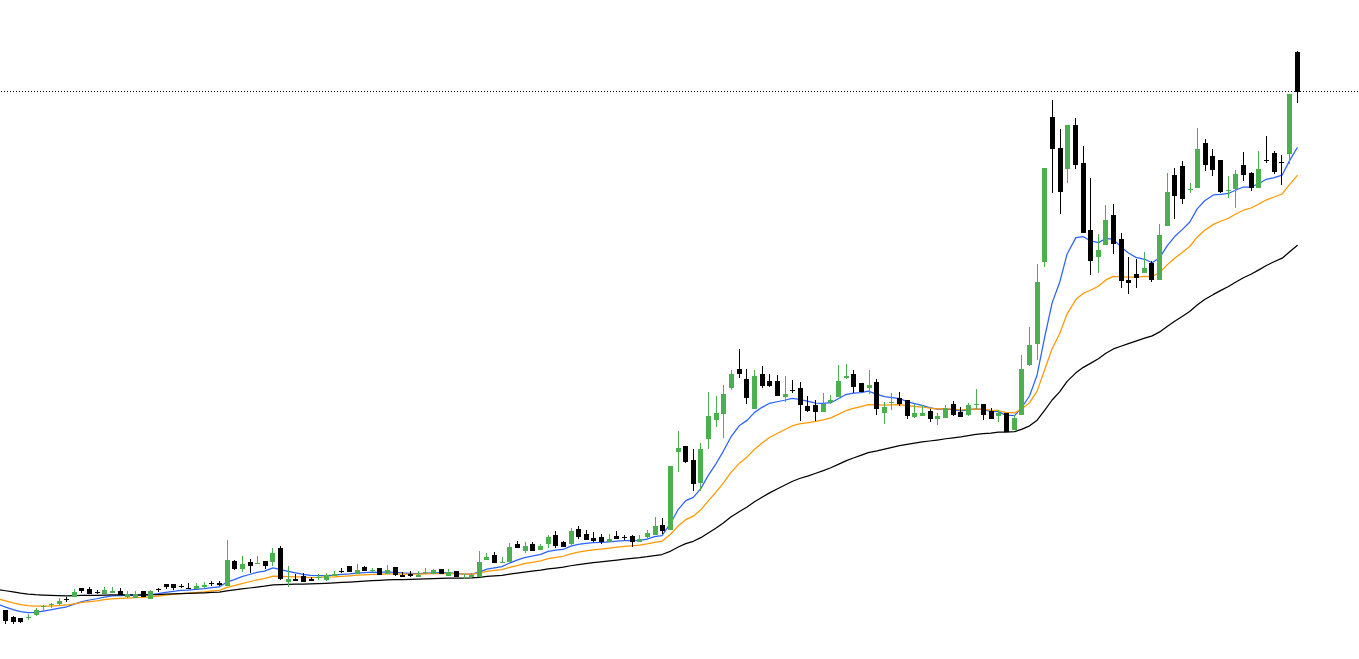
High Momentum - Stock making higher high & higher lows with explosive up volumes than down volumes & giving strong up leg (20 -30%+) surfing 10/20 day ema.
High Momentum Stock-
Low Momentum Stock-
There’s a difference between RS & Momentum -
Relative Strength measures one stock’s performance vs other stocks.
Momentum Measures the magnitude or speed of an asset over a certain time period. So a stock
Liquidity - Stocks must be sufficiently liquid for your portfolio size. As a individual trader our biggest advantage is to get in & out quickly. For this, you have to be in sufficient liquid stock so that at any point you don’t get trapped in circuit limits or suffer from heavy slippage costs. You can have certain values for ex Avg $ volume > 5cr or 10cr etc.
High ADR > 3% - In order to grow small account & want super performance (Triple digit returns) you want to be in fast stock (30%+ moves in 2-3 weeks ) So if you choose sluggish large cap stocks you need very long time to gain few % returns. Stock with high ADR% have High momentum as simple as that.
Low float/Market cap- (Market cap > 500cr) (Avoid penny stocks & mega cap stocks as well).Personally I prefer trading in small & mid cap stocks only. As you can find many growth stocks in this range of market cap.
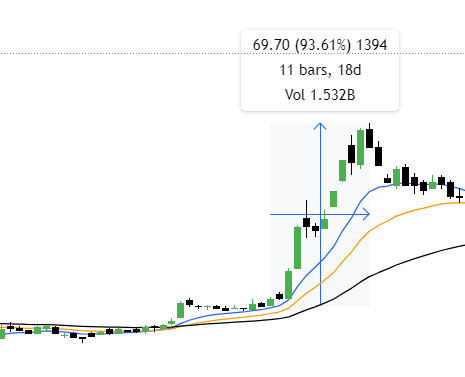
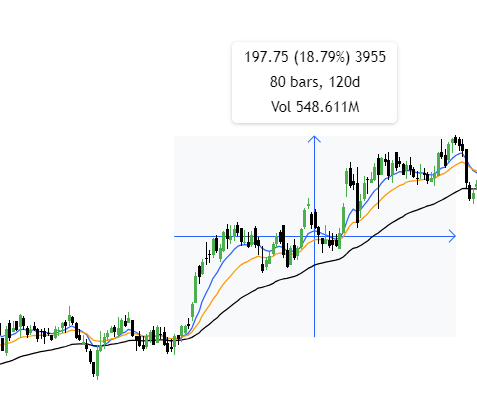
Linearity - Higher the better. Prefer the stocks which is showing linearity in its up move as well as base. Stock must move higher with above average volumes (Cluster of pocket pivot days) and relatively contracted volumes during it’s pullback/basing period.
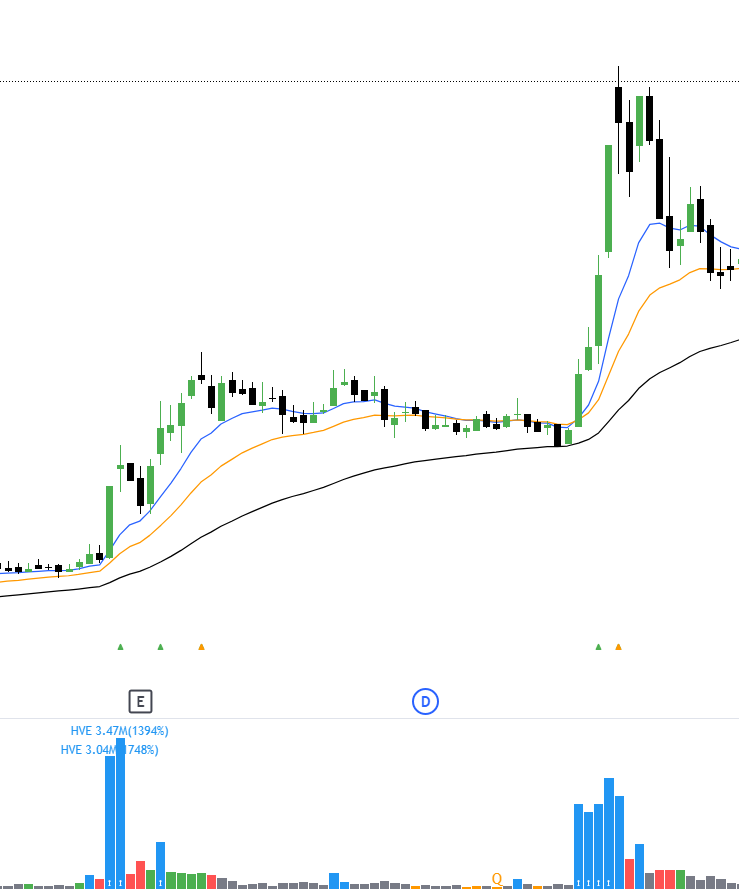
You can see in above picture how stock is moving up with huge volumes and then very contracted volumes during basing period & then again repeating the same. Although you won’t get such ideal stock always, but the point here I want to make is choose best of among many.
After applying these filters you will have your list of stock. I use scanner for 50% of these filters and then most of the work for nailing down the setup, I do it manually as I get feel of market and I feel it is the best way. I use simple top gainers stocks in 1 Month, 3 Months & 6Months to get these stocks. Then I manually go through them one by one on Weekly timeframe & then Daily timeframe to prepare my FOCUS WATCHLIST every weekend. ( If you want link of the scanner you can DM me on twitter/ comment down below )
Feeling lot of work. No it’s not. Once you actually deep dive on these stock setup, you will be able to recognize it within second on blink of an eye.
My observations on how stock unfolds it’s stage 2 -
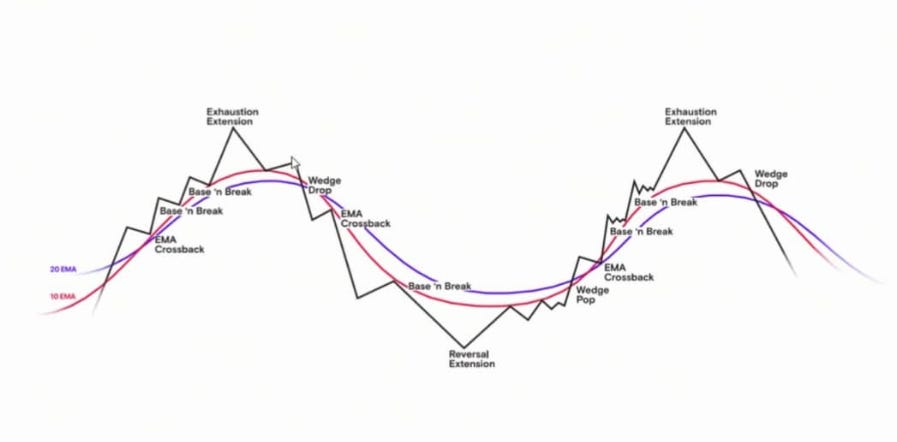
Below is the picture of Cycle of stock’s movement from Oliver Kell’s book.(A trader who made 941% in USIC in 2020 ) I recommend you all to read his small book. But here I want to make you understand nuances of Indian Stock Market.

Though the price action cycle remains more or less similar, but magnitude of moves and time it takes is different from US market. Which is important thing to know because on that thesis you can have your expectations. As you can see in above picture you have to deliberately miss the first up leg to get confirmation about stock’s change of characteristics into an uptrend. That is stock is setup into an upward motion & trading above key moving averages 10EMA, 20EMA, 50EMA and here stock must be in your watchlist. Then it will have staircase kind of up move of 3 to 4 up move or even more if it is really strong leader in its sector/theme before undergoing distribution phase. Now as a trader we are interested in that next 2 to 3 up leg swings.
Here are the key Observations about stocks up move
Average stock up movement in one leg is 25% -30% ( sometimes more or less depending upon stocks strength and market conditions but if you are choosing right momentum stock this kind of swing you can grab regularly). During this up move stock generally surfs (stays above) 10/20 day EMA which you can clearly see in examples given below.
The potential of stock to give explosive up move decreases as it goes to 3rd or 4th base and further. So it is always better to be in stock which is about to unfolds its 2 nd or 3rd leg not much beyond.
To get this kind of move stocks must have base 3 - 4 weeks+ (25 - 30 days +) of sometimes more. Yes there will always be exceptional cases where stock may unfold next leg immediately after just 2 weeks (10-15 days) but remember trading is business & if you want sustainable growth you have to rely of what generally happens on average and turn up your edge multiple times to compound small gains. (Personally I prefer longer bases)
You will always see clear distinction between volume during up move and volume during basing period. Up move volumes should be explosive/ above average & then muted volumes (Below average ) during basing period which makes odds better to look for next up leg. ( Take a look a image given below Linearity topic)
Quality of base - It says lot about potential of next leg. Lower & lower volatility in price & volume from left to right says supply coming in that stock is drying up and upcoming demand will push it again into momentum. Similarly if base have HH & HL structure within the base then that’s also positive sign. If Stock has given Fakeout or shakeout that again increases the probability of its working out. ( Here I want to convey you that if you ever got shaken out of trapped in fake breakout do not remove that stock from your watchlist until the larger picture of setup is intact. I missed lot of big moves just caz I got wrong 1-2 times before it finally moves . See you cannot time BO day every time so you need to keep you SL and patience with quality stock setup)
Below I will give some examples with which you will get clear visual understanding of what I written above and you can find stocks on your own.\
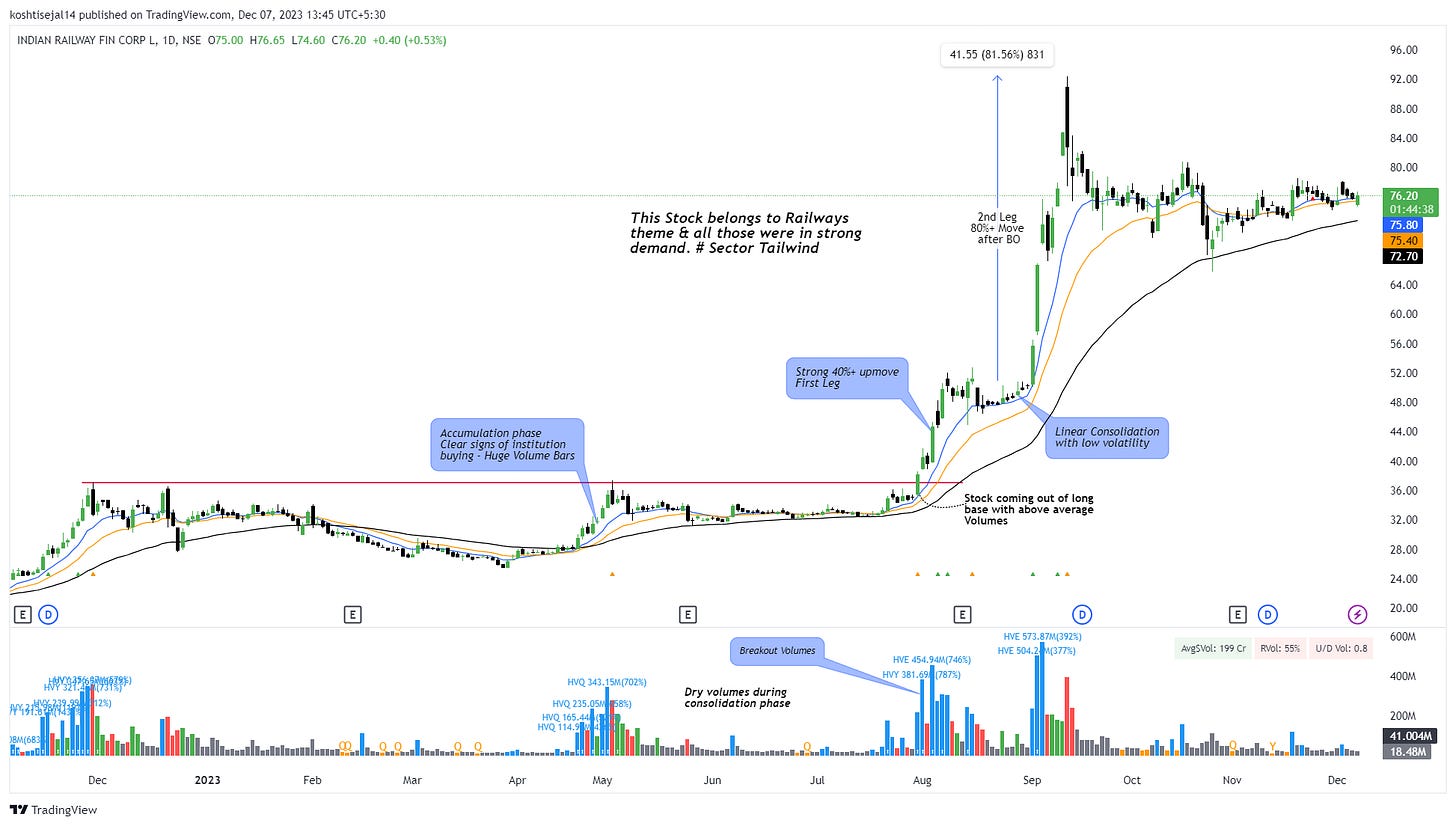
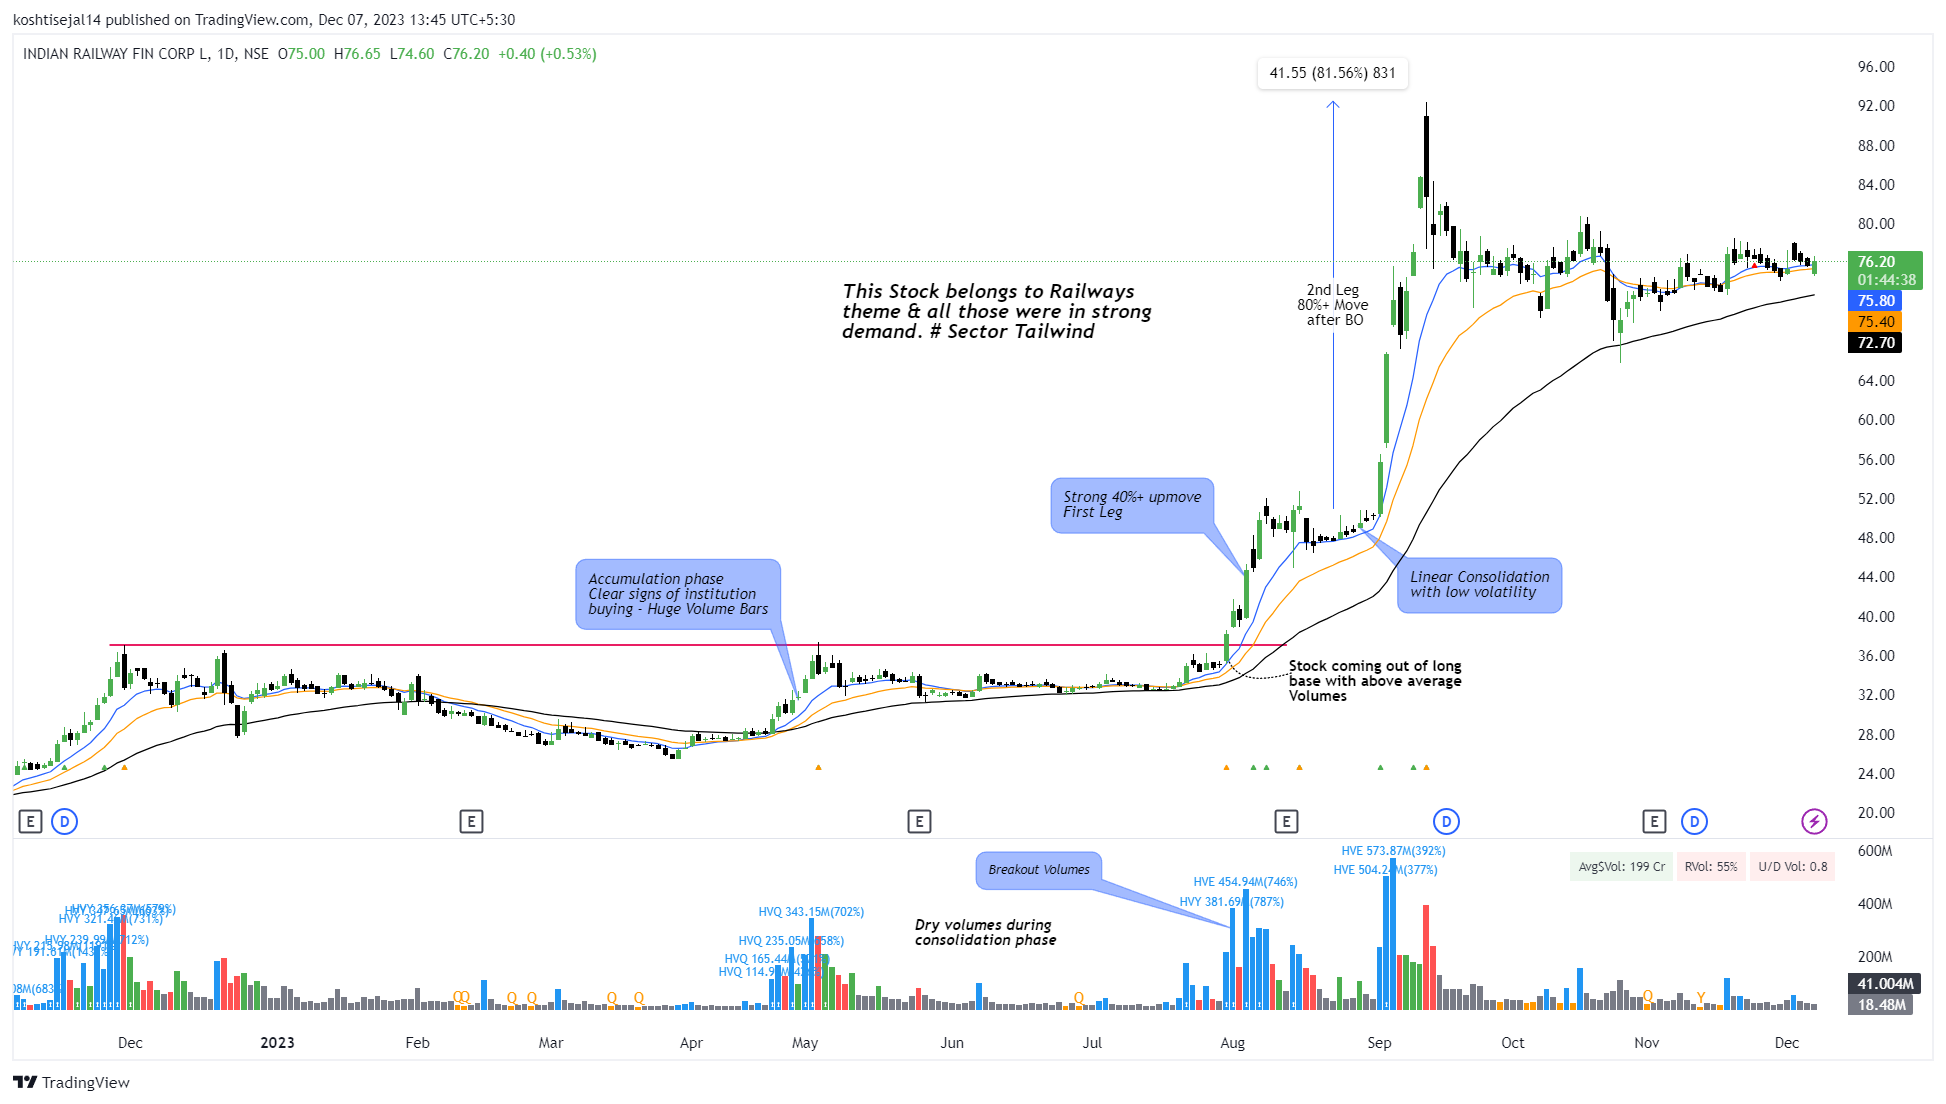
IRFC - Long Base Breakout + Strong Up moves + Linearity in base and up legs in price as well as Volumes
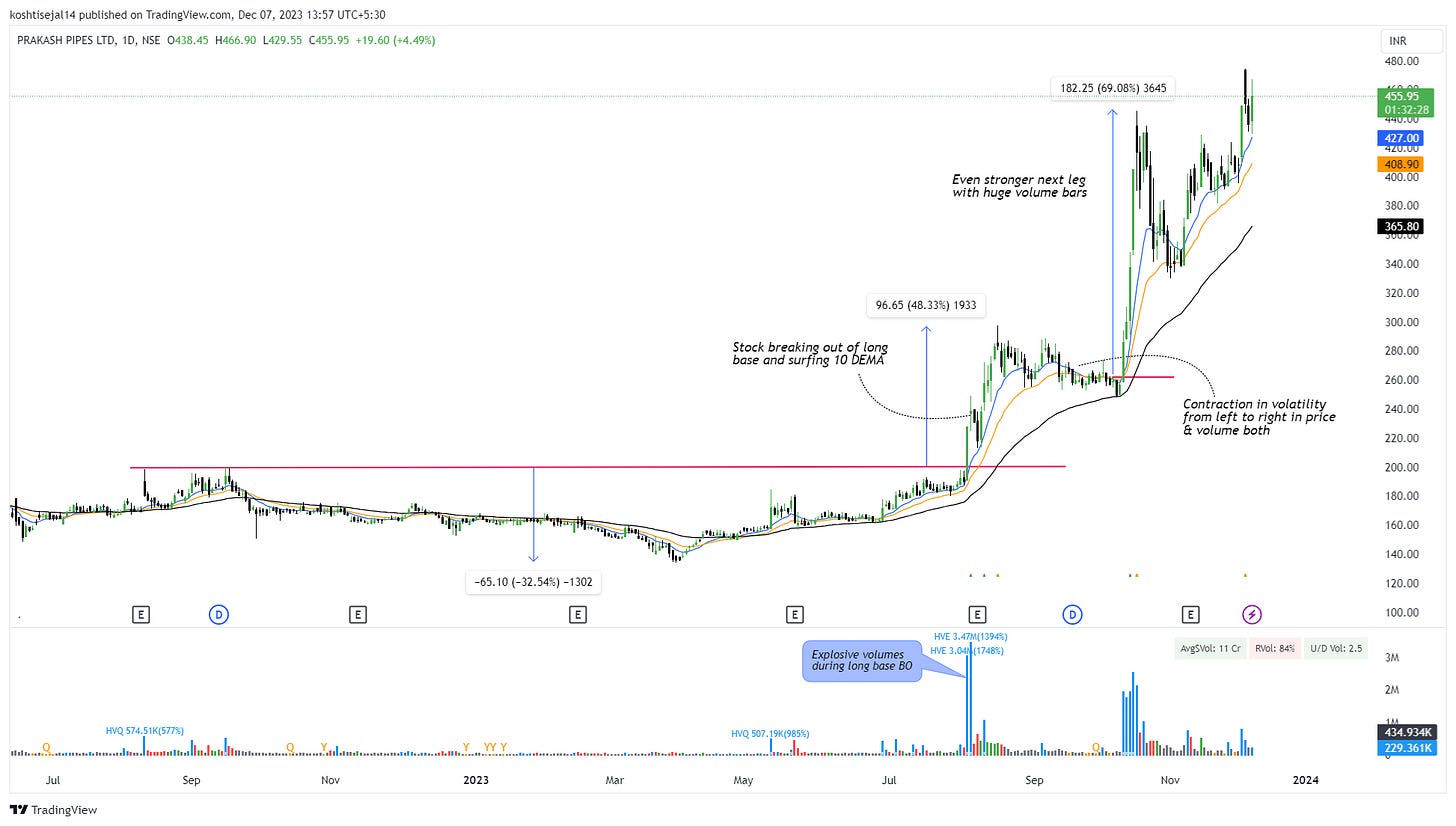
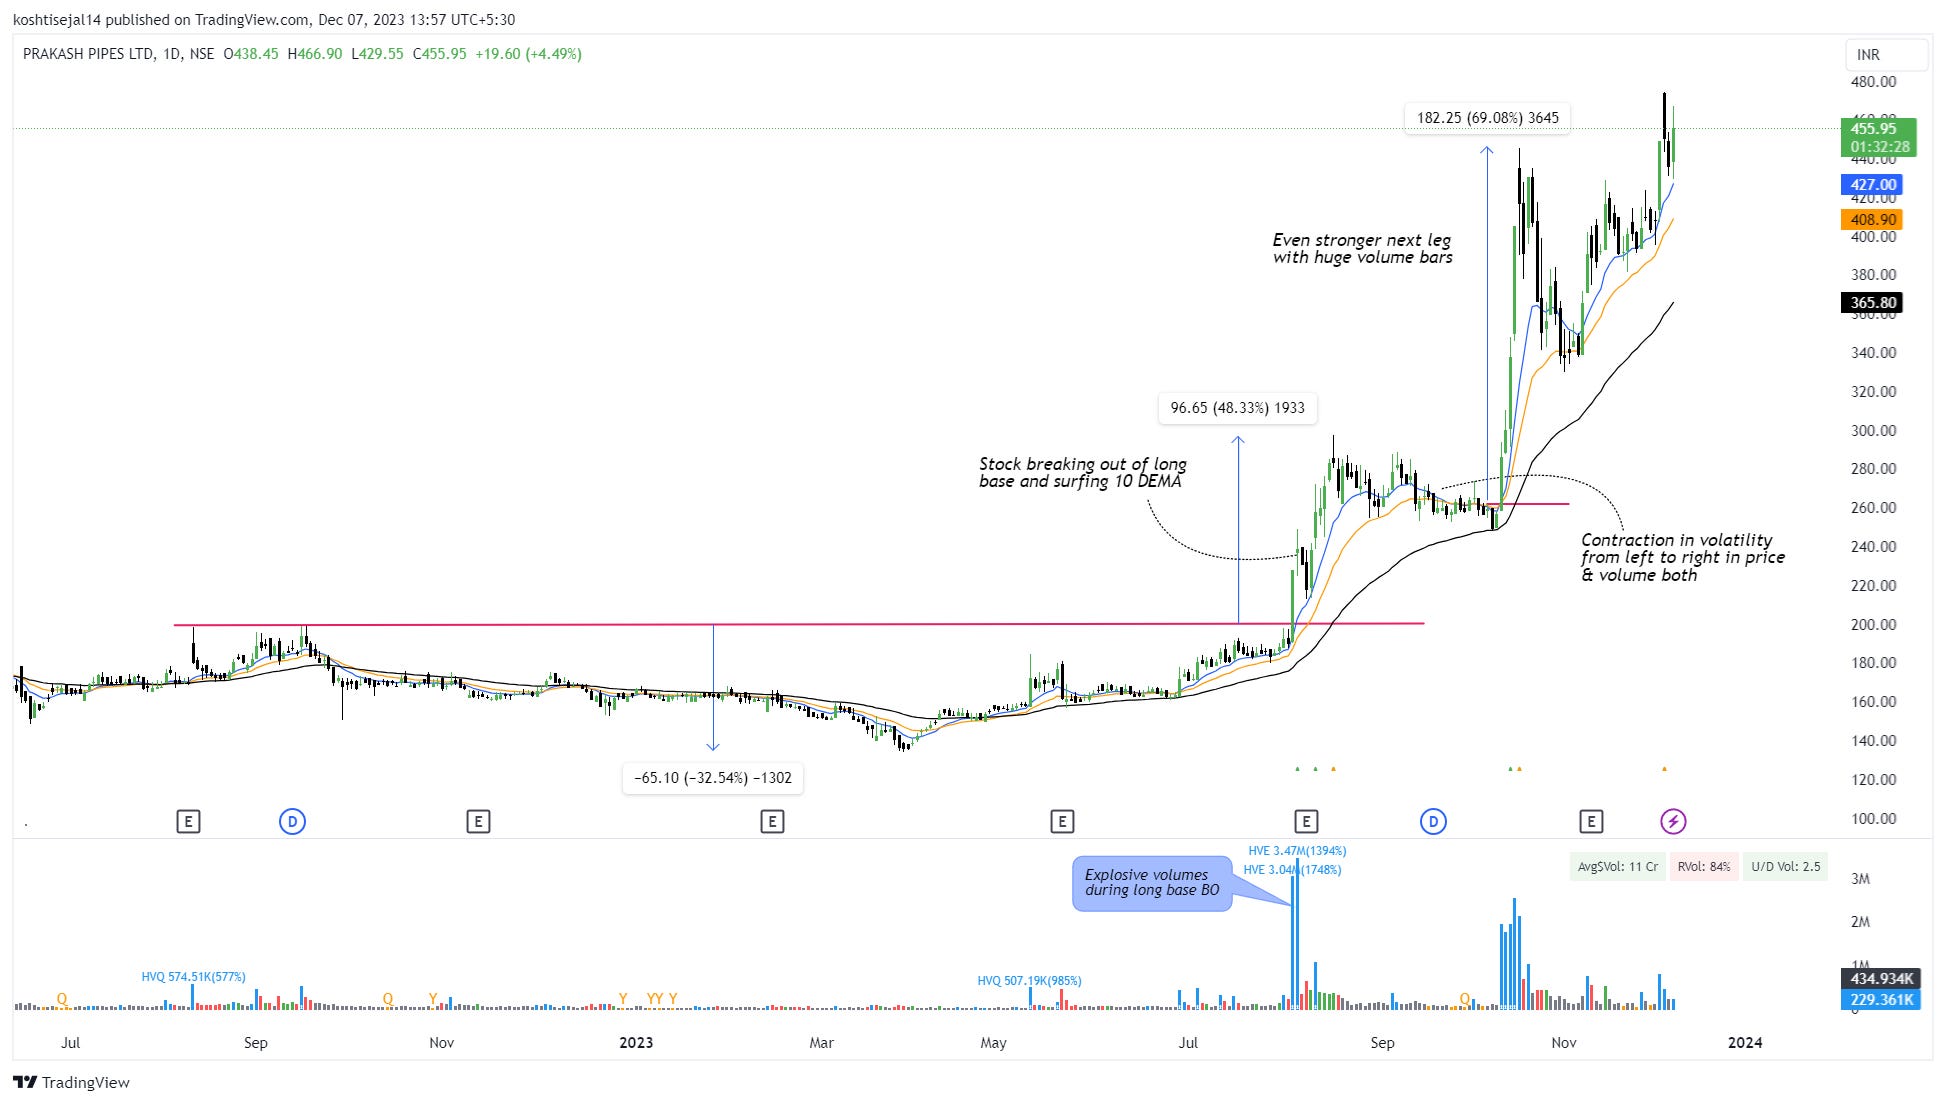
2. PPL
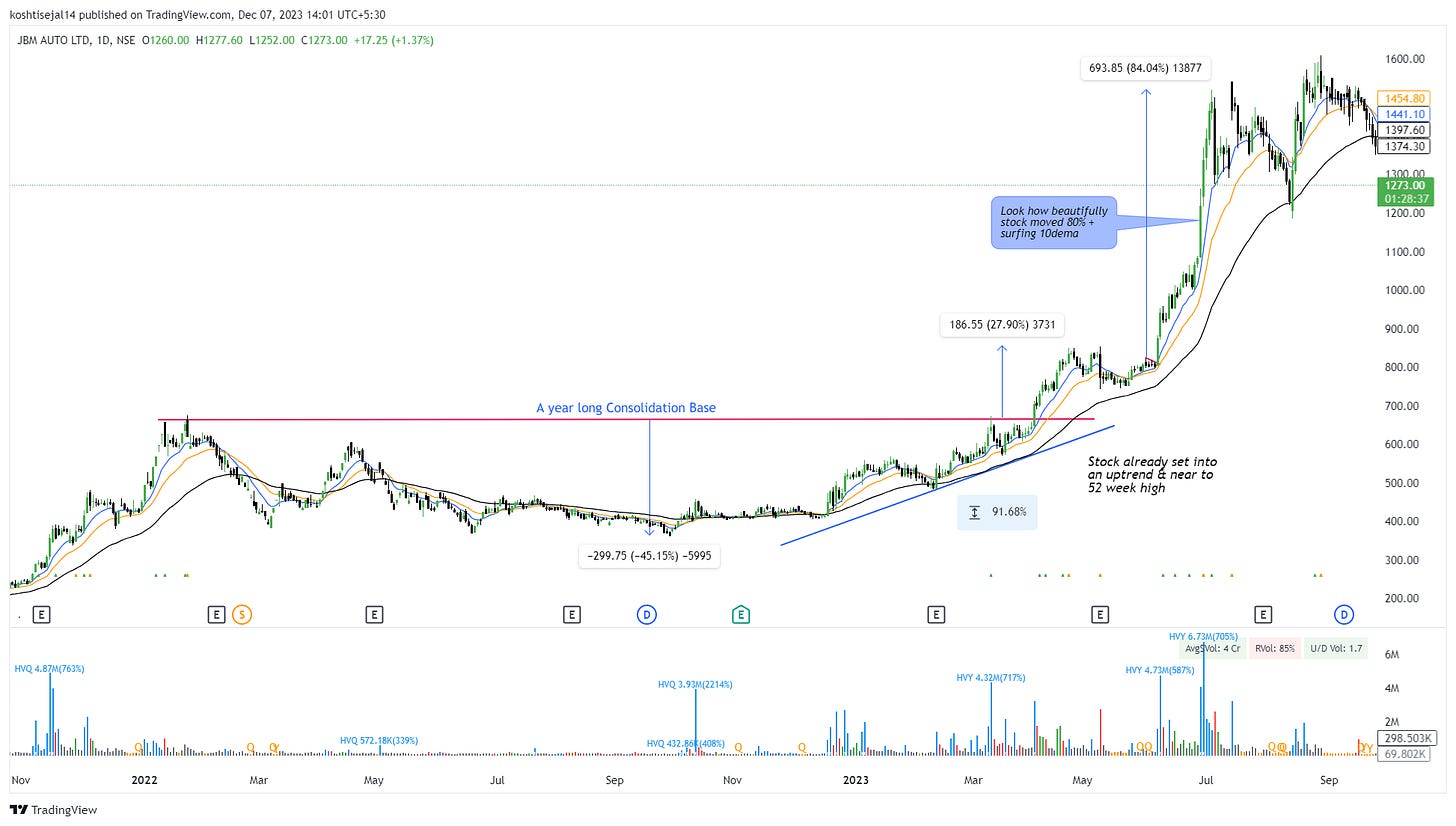
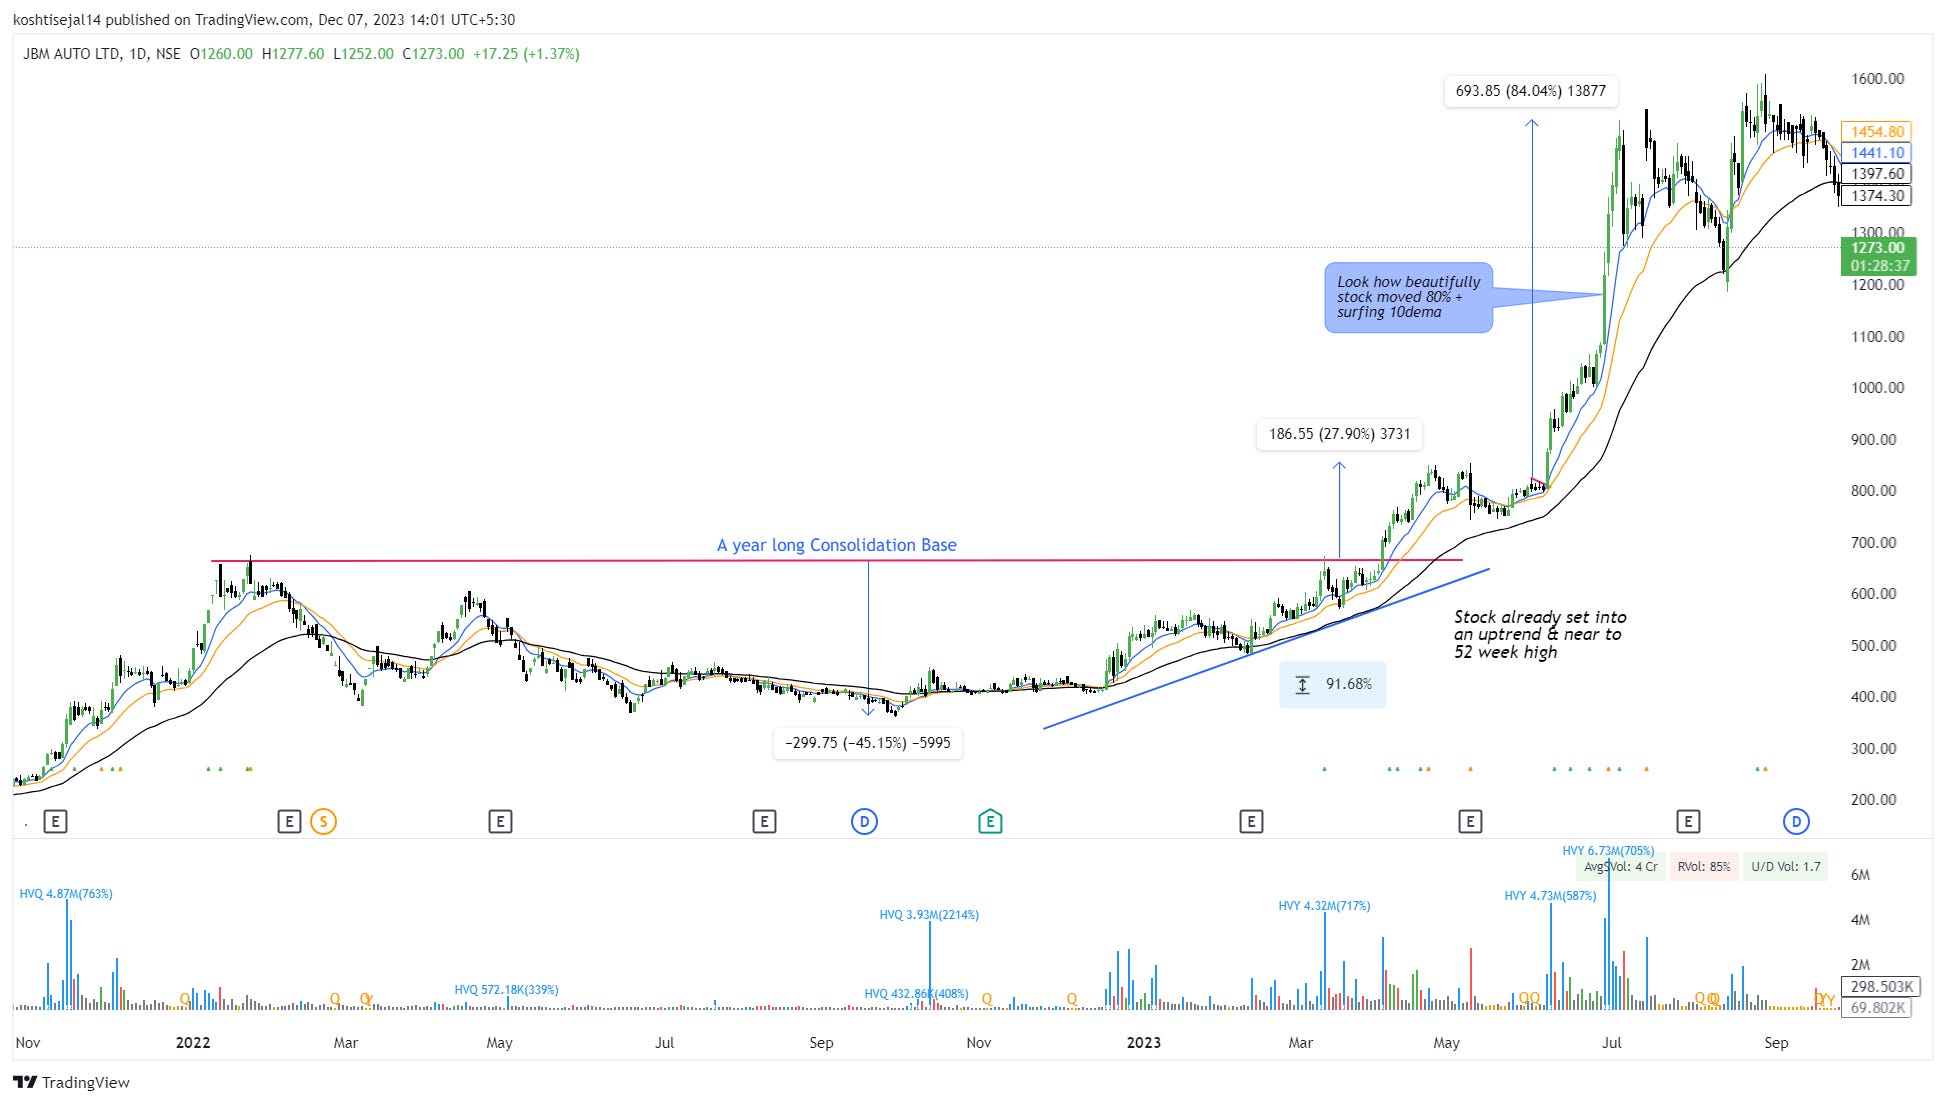
3. JBMA
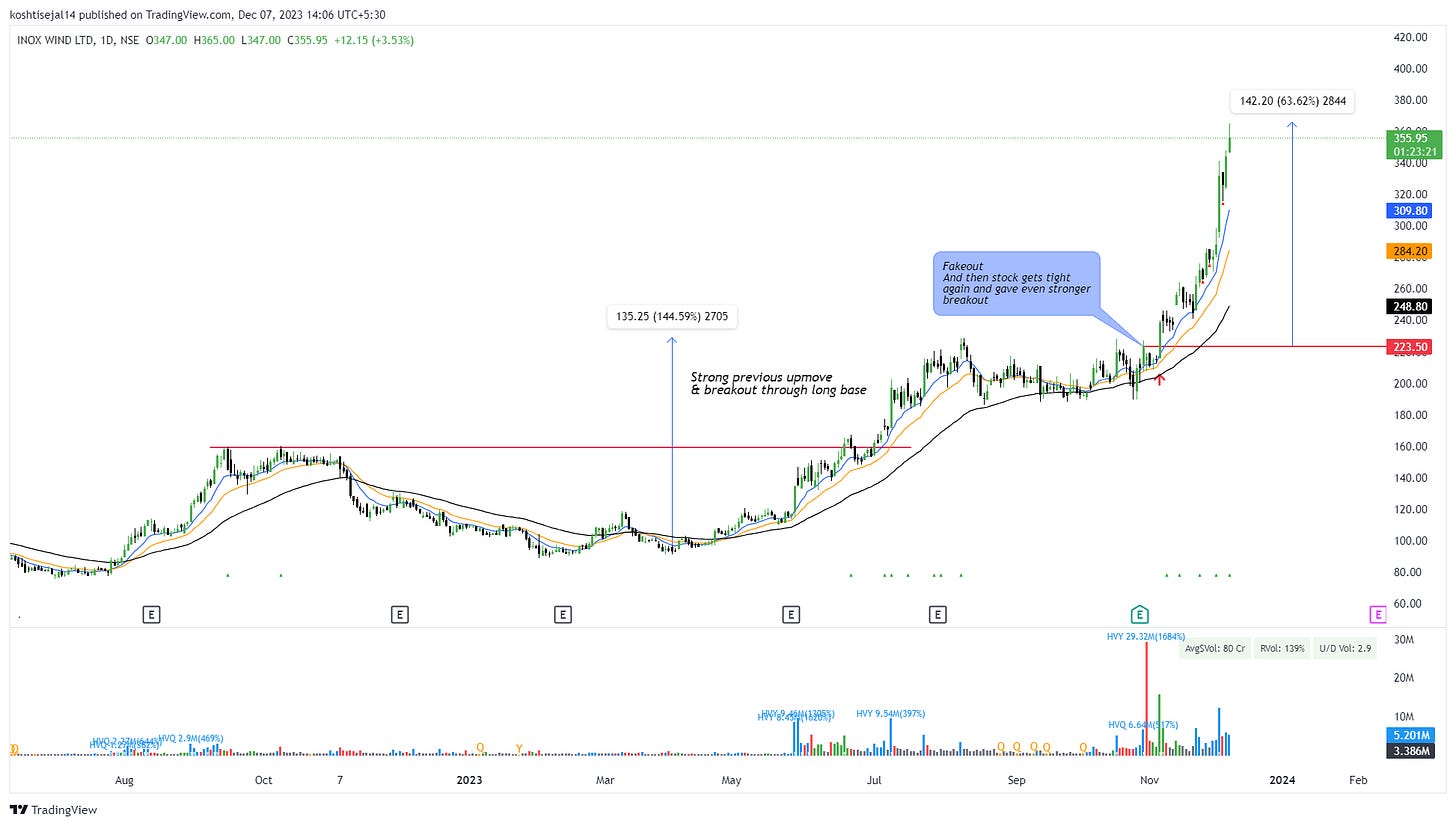
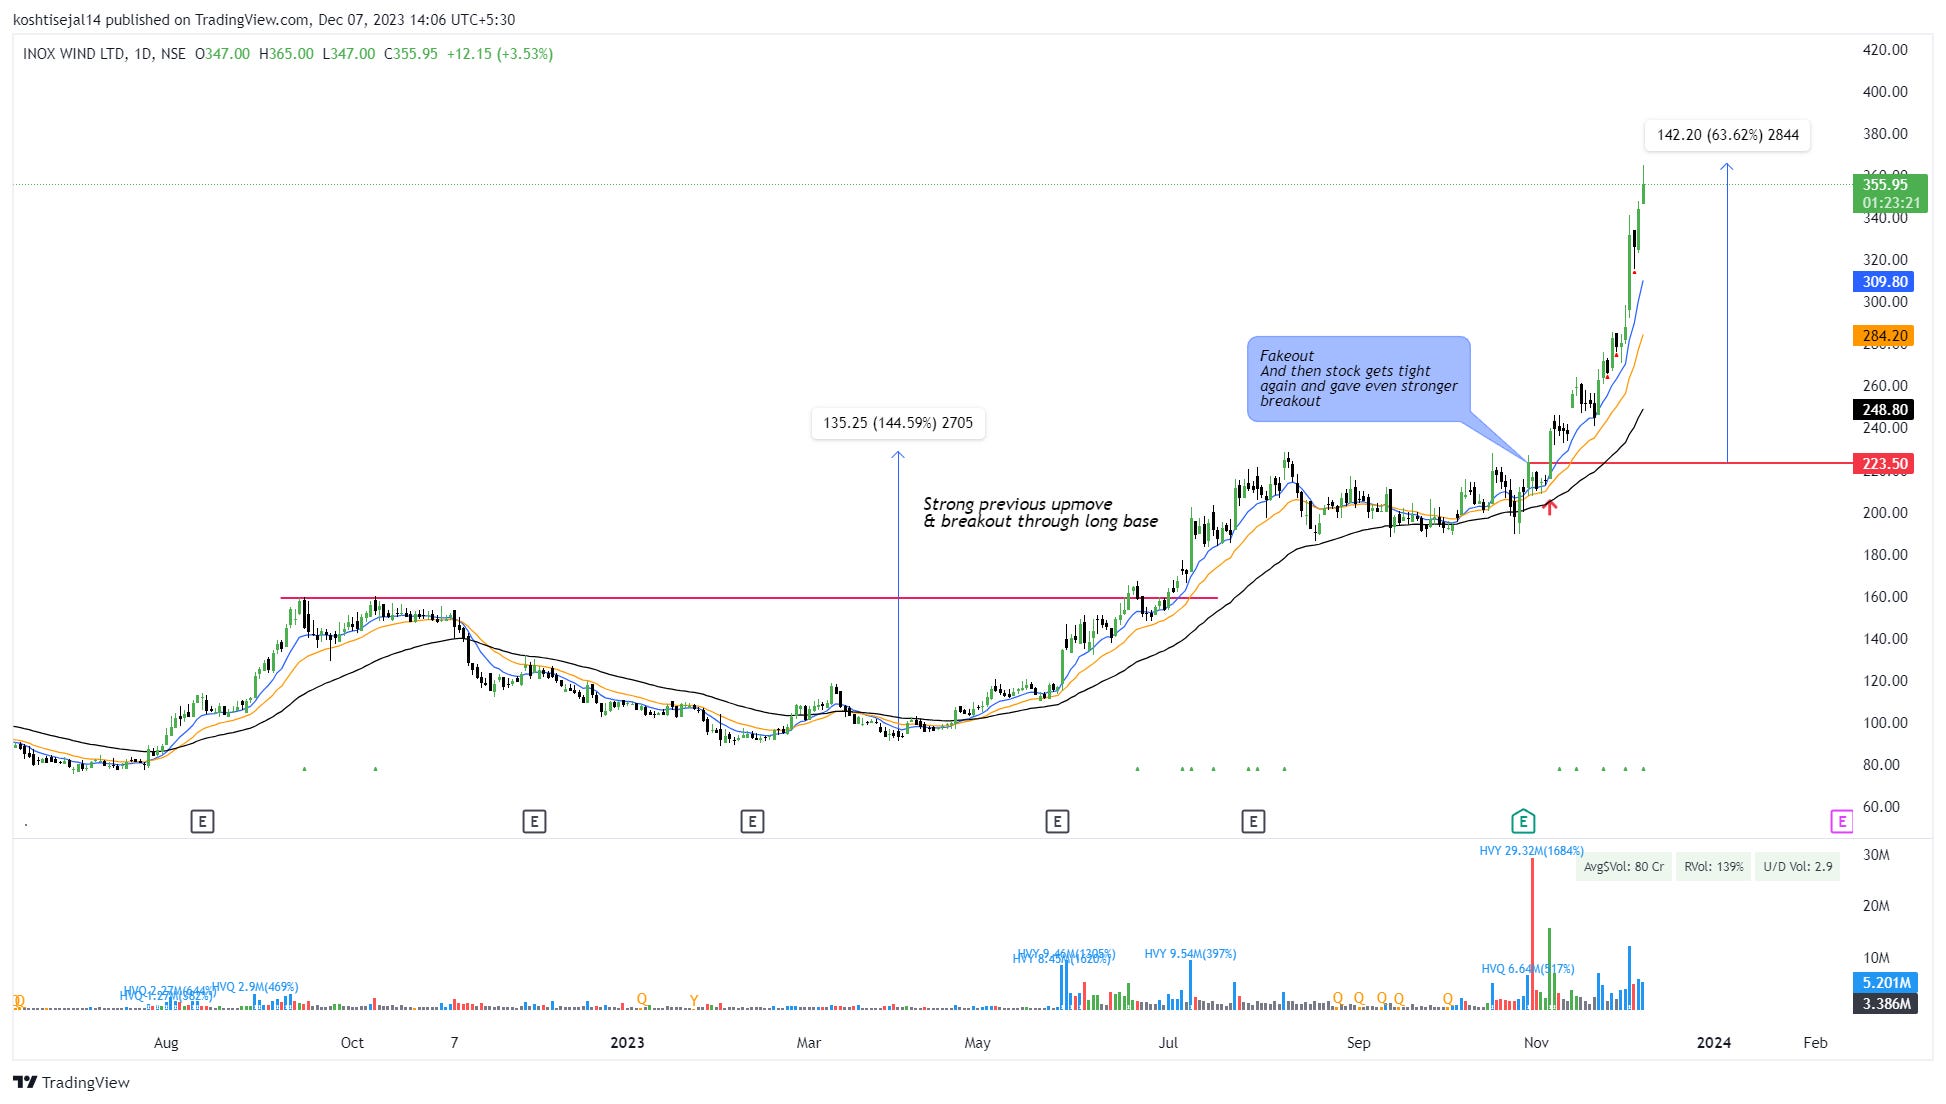
4. INOX WIND LTD
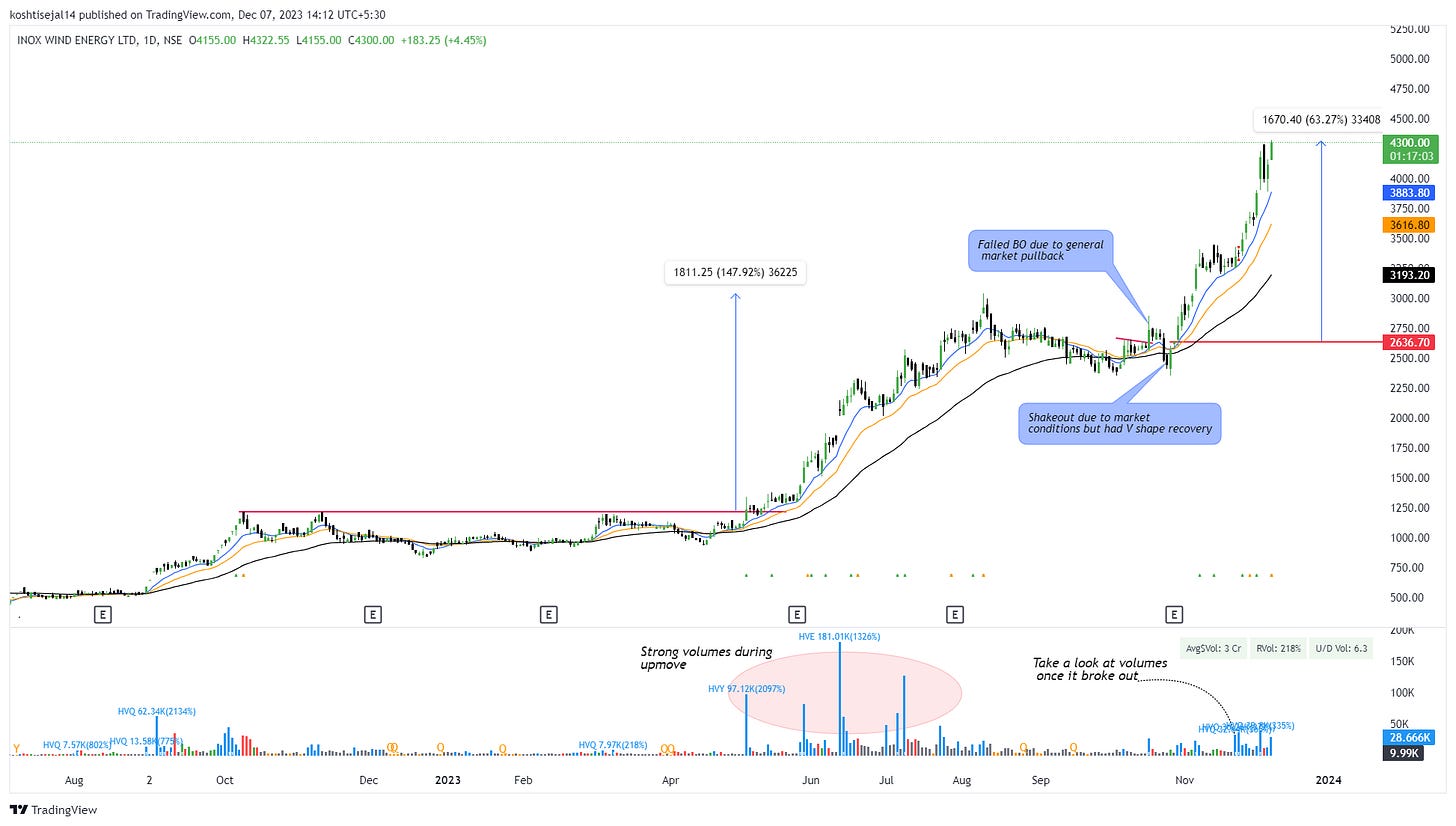
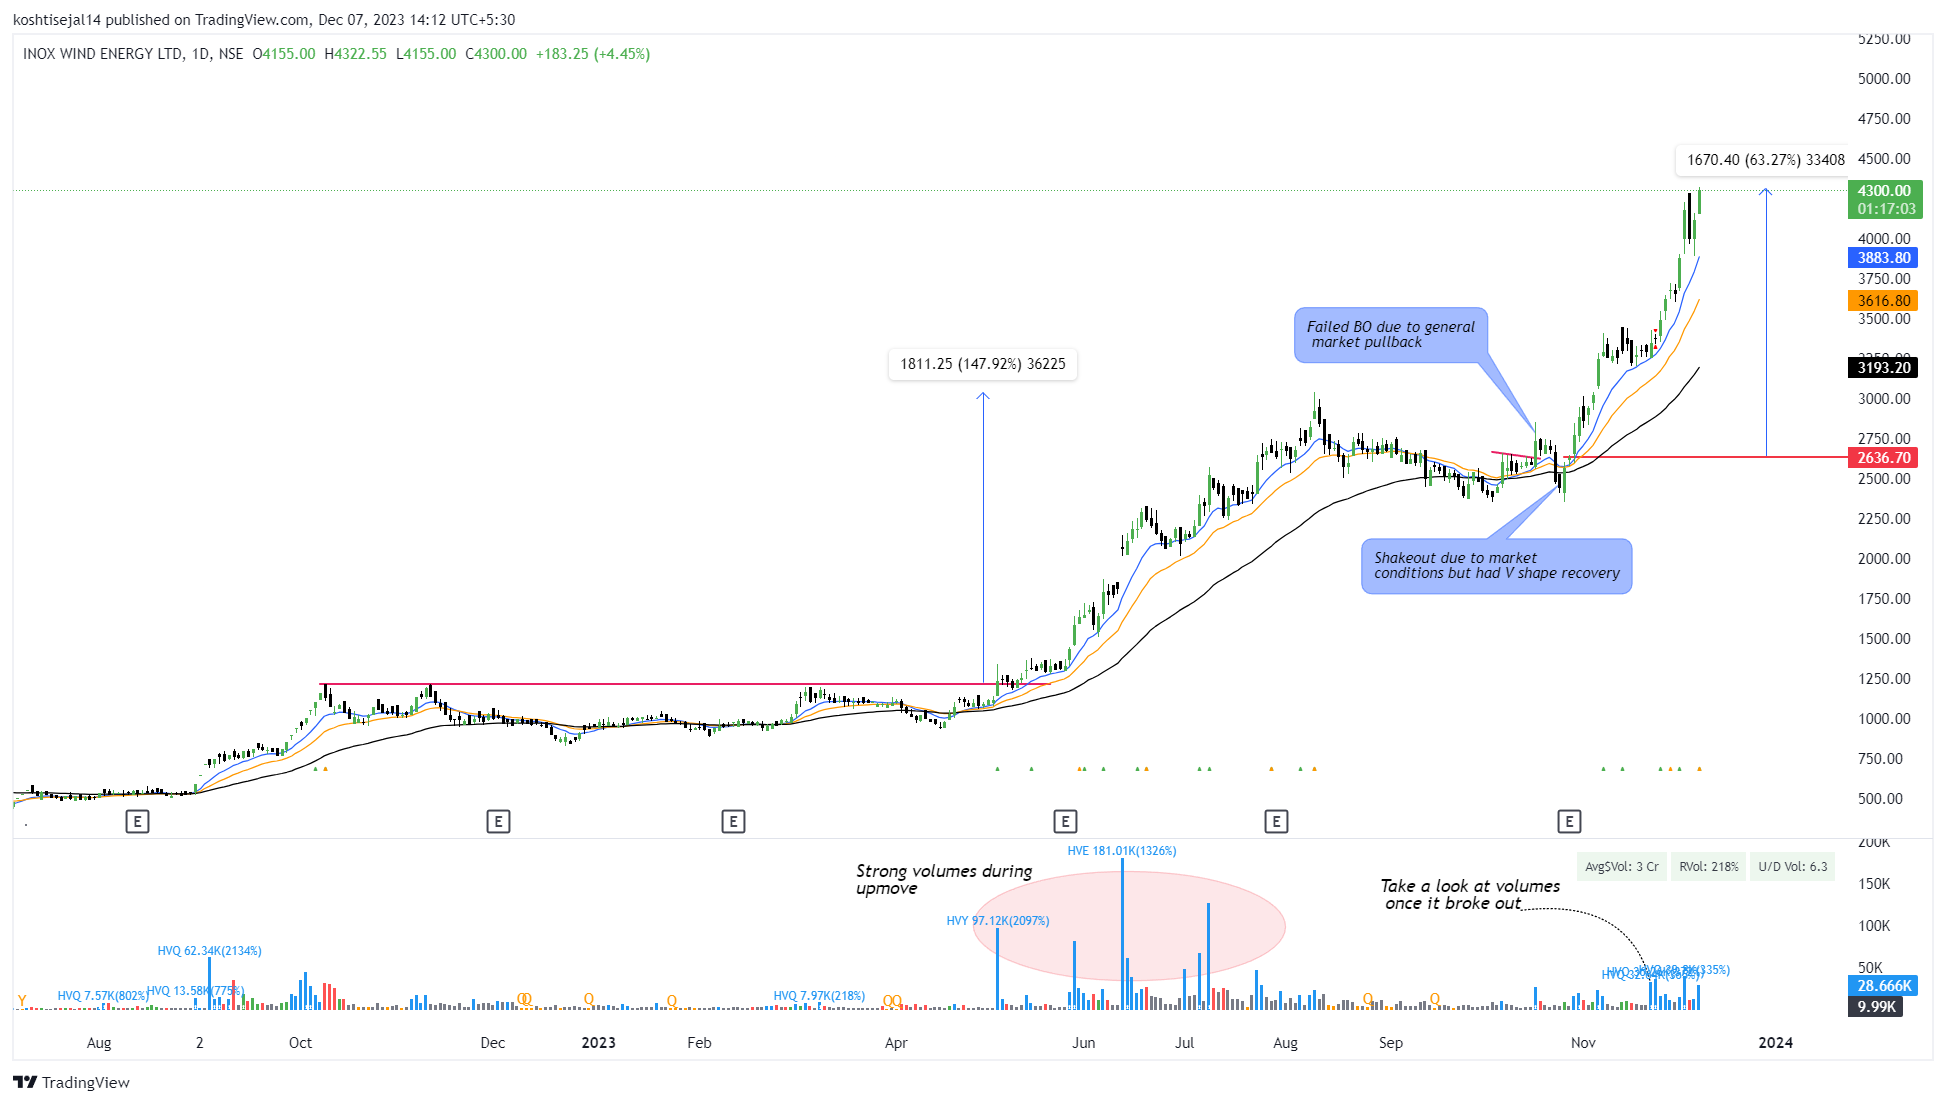
5.INOX WIND ENERGY LTD
These are very few examples I have shown here. On basis of above points and examples gives try to find out as many stocks you can find and make a data base for yourself to train your brain and eye. I will post many such ex on twitter so hit follow button. I hope you will have fair understanding of what kind of stocks you have to hunt for. Still any doubts - Do let me know in comment section or DM me on twitter, I will be happy to help you out. Also if you want scanners & how I organize my watchlist do let me know. I will make posts on How I Enter The Stock ? How I Organize My Watchlist ? How I DO Trade Management & much more in further posts, so stay tunned !!
Thank You !!!


PLEASE SHARE THE SCREENER LINK
Thank you for sharing 🙏